Posts

Showing posts from September, 2019

Randomized Out of Sample

Image
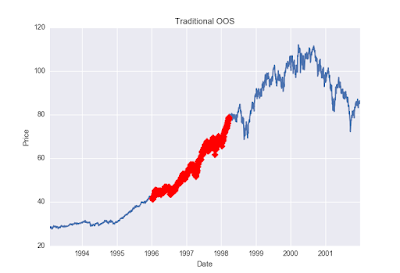
First, what is out of sample testing? Out of sample testing is purposely withholding data from your data set for later testing. For example, let’s say we have ten years worth of data and select to designate the last 30% of the data as out of sample data. Essentially what we do is take the last 3 years (30%) of the data set and put it in our back pocket for later use. We then proceed to create trading strategies using ONLY the first 7 years of data or the “in-sample” data. BuildAlpha : Let’s assume we find a great looking strategy that performs extremely well on the first 7 years worth of data. What we would then do is take the last 3 years worth of data, or our out of sample data, out of our back pocket and proceed to test our strategy on this “unseen” data. The idea is… if the strategy still performs well on this unseen, out of sample data then it must be robust and we can have increased confidence it will stand the test of time or at least in how it will perf

Utilize Automated Trading Software to Increase Trading Edge

Image
Have you ever thought about how you can automate your trading strategies and increase your edge? Yes or No? Here, you will get to know the basics of algorithmic trading, the benefits, and the risks. Get ready to utilize automated trading software like  Build Alpha . A lot of technical analysis involves surveillance pointers for signals and then trading based on the signals. What if you could program a computer to mechanically and automatically recognize these setups and enter trades automatically? Isn’t it good if you free yourself from giving trading instructions to the system continuously? Yes, this is possible. Computers are much better than human at doing the math. If an individual can recognize setups that make you the most capital, so can a computer. In fact, computers are quicker and more accurate than a human being at solving math problems. So, why not to tell the machine what the norms of the game are and let it trade for you. These days, much automated software like  Bu

Noise Test

Image
First, let’s talk about overfitting and what it is. I will simply define it as fitting a function or model to data so well that the function or model is not generalizable and cannot/will not work on another data set. In trading terms, it is designing a strategy that trades historical data so well that it will surely fail on new data . Build Alpha :  The first and most obvious test to prevent curve fitting is out of sample testing. In other posts I’ve described this, but in short, it is simply withholding a portion of your data to “validate” the strategy. For example, you have 10 years worth of data and you designate the first or last 30% to be out of sample. You build your model on the remaining seven years of data and then validate it on the withheld 30% or out of sample data. However, and for various reasons, this might not be enough to prevent against curve fitting. There are two parts to the underlying data: the signal and the noise. It is often said that when something is cu

3 Simple Ways To Reduce Risk Curve-fitting

Image
Curve-fitting is almost certain death for a trading or investment strategy. So, what is Curve-fitting? Well, you know when you test a trading or investment hypothesis, fall in love with the historical results, and then the idea fails to generate similar (or even positive) returns once you decide to trade it live? Most of the pitfalls of system trading and trading, in general, can be avoided or mitigated following these three simple techniques or rules of thumb. 1.  Use out of sample data! Out of sample data is simply withholding some of the data in your “test” period for further evaluation. For example, you have ten years of historical data and opt to put the last 30% in your back pocket. You develop a great trading strategy on the first seven years of the data set and then whip out your “out of sample” data (remaining 30% from your back pocket) and validate your findings. If the strategy fails to produce similar results in the out of sample data then you can be almost certai

Using Conditional Probabilities To Gain A Trading Edge

Image
Much of trading can be broken down as conditional probabilities. And there’s a distinct benefit in understanding what is likely to happen if some condition (or set of conditions) is true or not. Build Alpha :  For example, is tomorrow more or less likely to close higher if we are above the 200 day moving average or below the 200 day moving average? However, there has been much talk about seasonality as we approach summer trading. For that reason, I would like to share some simple graphs showing how the big stocks and ETFs fair on each day of the week. In other words, do certain stocks or ETFs perform better on certain days of the week or is day of the week meaningless/random? BuildAlpha :  We have all heard about “Turnaround Tuesday” for the S&P500, right? How about buying Gold on Friday ahead of the weekend? Let’s see if these market axioms are true (they are). Below are charts showing the gains achieved on each day of the week for each stock an

Building A Strategy with Open Interest

Image
As always, happy Friday! This week I was asked by a  Build Alpha  user if he could build strategies using a contract’s open interest. Open interest is just the total number of outstanding contracts that are held by market participants at the end of each day. So it is intuitive that as more contracts are opened or closed then it might be telling of how traders are positioning. This is a detailed and advanced post. Build Alpha is all point and click, but this is certainly a way more advanced blog post showing how a more sophisticated user can utilize the software. I have to admit this is not something I have looked at previously so I was quite intrigued but I pulled some open interest data from TradeStation and saved it. I then went on to create columns I – M below. Columns I-L are momentum measures (N period change) of Open Interest. For example, column J holds the Open Interest change over the past 5 days. Column K holds the Open Interest change over the past 10 days. Column

Human Can Add Value to Automated Trading Process

Image
First, I need to describe over-fitting or more commonly known as curve-fitting. Curve-fitting is creating a model that too “perfectly” fits your sample data and will not generalize well on new unseen data. In trading, this can be thought of as your model too closely fits the historical data and will surely fail/struggle to adapt to new live data. Here are two visuals I found to help illustrate this idea of curve-fitting. So how can we avoid curve-fitting? The simplest and best way to avoid curve-fitting is to use “Out of Sample” data. We simply designate a portion of our historical data (say the last 30% of the test period) to act as our unseen or “Out of Sample” data. We then go about our normal process designing/testing rules for trading or investing using only the first 70% of the test period or the “In Sample” data. After finding a satisfactory trading method we pull out our Out of Sample data and test on the last 30% of our test period. It is often said that if t