Posts

Showing posts from August, 2019

Testing Moving Averages On Popular Stocks & ETFs

Image
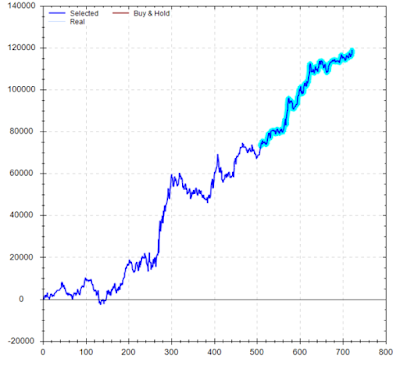
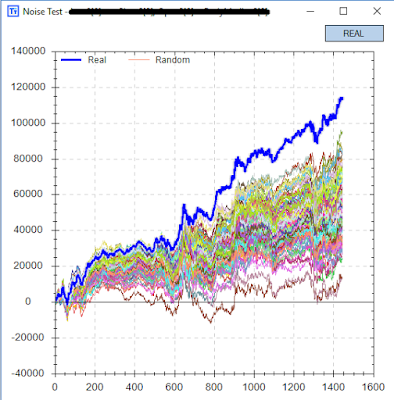
So many traders quote market axioms and some actually put their hard-earned money on the line based upon them. The most popular (arguable) technical indicator is the moving average. Everyone knows what it is and almost everyone still tracks one or two of them. It is generally believed that a stock trading above its moving average is bullish and stock trading below its moving average is bearish. BuildAlpha :  The question I pose is… Have you ever tested to see if that truly is the case? In this post, I will examine 4 popular moving averages and their impact on returns across 30+ ETFs and popular individual stocks since January 2006. In this case, pictures say more than any more text can. The main takeaway is that each stock and ETF has its own players and personalities. Each security responds differently to technical environments. It is crucial to understand if you should be buying dips or waiting for confirmation. I always recommend testing everything – and if yo

What Does 2019’s Hot Start Mean for Stocks This Year?

Image
The S&P 500 index has gotten off to a hot start in 2019, so I decided to dive in and see just how hot the stock market has been on a historical basis. And what it may mean. On a closing basis, I calculated the rolling drawdown (peak to trough) and the return for each year through the first week in April starting since 1960. BuildAlpha : Using a profit to drawdown ratio of those two values, 2019 ranks as the fourth-best year since 1960. Here is a quick list of the top years and conversely a snapshot of the bottom years 1995 +8.19 1964 +7.71 1961 +6.77 2019 +6.15 1967 +5.08 1977 – (0.95) 1992 – (0.87) 1973 – (0.84) 1962 – (0.69) 1974 – (0.63) Of course, we cannot capture the bullish strength through the first week of April at this point. So how did the top years do from April onward? Across the top of the chart you can see the year, the percentage return from the first week of April until year-end, the peak to trough drawdown from the first week of

A Strategy For Each Day of the Week

Image
A different strategy for each day of the week? Sounds crazy, but is it? This simple strategy is actually at new highs since this was published over 10 months ago! But what about other markets? Is it possible to just trade one market per day of the week (from open to next day’s open) on a specific day of the week and still do well? If you would have followed this simple “portfolio” below for the past 15+ years then yes.. you would have. You wouldn’t even of had to sit in front of the screens like the rest of us degenerates. Strategy 1: Short Crude Oil on Mondays Simple strategy dating back to 2003. Short Oil on Monday’s open and cover on Tuesday’s open. Results based on a 1 lot. Strategy 2: Turn Around Tuesday If Monday was a down day (Monday’s close less than or equal to Monday’s open) then buy Tuesday’s open and sell on Wednesday’s open. Results based on 1 lot. Strategy 3: Long Gold on Friday’s. Weekend Risk. Maybe in lieu or anticipation of bad weekend news release

Noise Test and Lying Backtests

Image
Can you trust a backtest? Below is a simple strategy that uses Intermarket signals from the Japanese Yen to trade US 30 Year Bond Futures. It only has 2 rules for entry. The strategy produces fairly stable in-sample returns especially for being so simple. The in-sample period is from January 2003 to August 2012. The Intermarket strategy actually performed quite well out of sample on our unseen data as well. The out of sample data is from September 2012 to October 2016 (highlighted in blue). The ability for a strategy to continue to perform on unseen data is paramount and mission-critical for many system traders and strategy architects. However, can you trust this backtest? In BuildAlpha , there are many validation and robustness tests that can add confidence to your system development process. There is a special test called the “Noise Test” which creates 1000 new price series by adding and subtracting varying amounts of noise from the underlying price data. The tes