Noise Test
First, let’s talk about overfitting and what it is. I will simply define it as fitting a function or model to data so well that the function or model is not generalizable and cannot/will not work on another data set. In trading terms, it is designing a strategy that trades historical data so well that it will surely fail on new data.
Build Alpha: The first and most obvious test to prevent curve fitting is out of sample testing. In other posts I’ve described this, but in short, it is simply withholding a portion of your data to “validate” the strategy. For example, you have 10 years worth of data and you designate the first or last 30% to be out of sample. You build your model on the remaining seven years of data and then validate it on the withheld 30% or out of sample data.
However, and for various reasons, this might not be enough to prevent against curve fitting. There are two parts to the underlying data: the signal and the noise. It is often said that when something is curve fit it is “fitted to the noise” and does not capture the underlying signal. The Noise Test is a test to see how close we have fit to the “noise” in our price data.
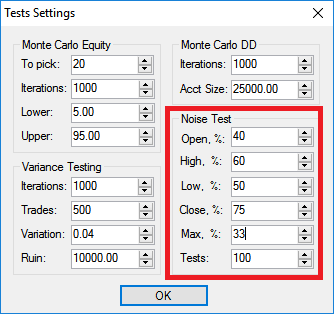
The Noise Test adjusts the original price data by differing amounts (user selected) and creates hundreds of new price series. For example, the trader can select to change up to 40% of the opens, 60% of the highs, 50% of the lows, and 75% of the closes. Additionally, the trader can select by how much he’d like to adjust the price data – let’s say by up to 33% of the average true range. Here’s what this exact configuration would look like in Build Alpha.
Below I’ve attached photos that show 4 “noise altered” price series created with the settings above for the S&P500. The charts below display the period of the August 2015 ETF crash. You can see how some bars have changed and some have even turned positive when originally negative and visa versa.
It still mimics the original S&P500 data and that is ideal as we want to keep certain elements of the original data such as the volatility clustering, e.g. However, we’ve change the amounts of noise in each newly created series by adding or subtracting various amounts.
Noise Altered
The Noise Test will then trade the strategy on each newly created price series and display the resulting equity curves. If the original strategy was “fitted to the noise” then the strategy should not maintain profitability as we adjust the noise in the data. However, if the Noise Test results remain profitable then we can have increased confidence a strategy was trading the underlying signal and not the “noise”. Below is the output of the Noise Test in BuildAlpha.

Originally Posted: https://www.buildalpha.com/noise-test/


Comments
Post a Comment